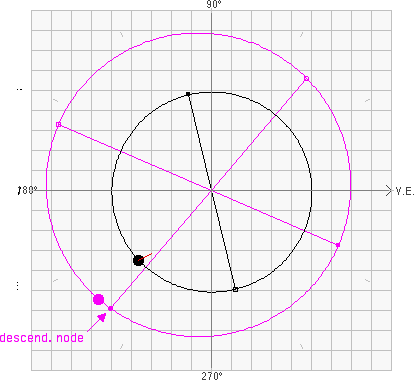
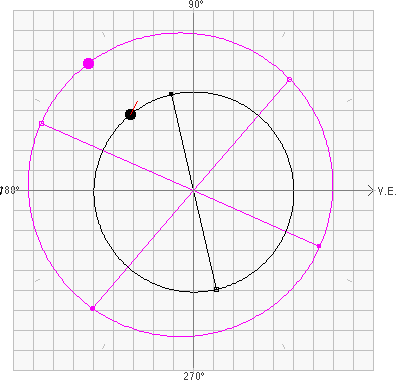
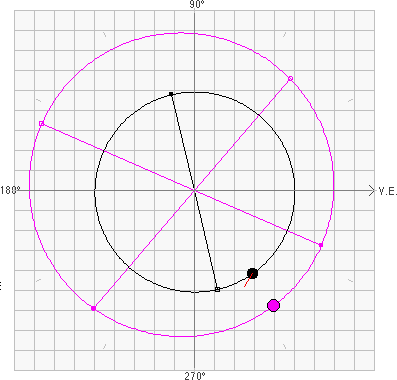
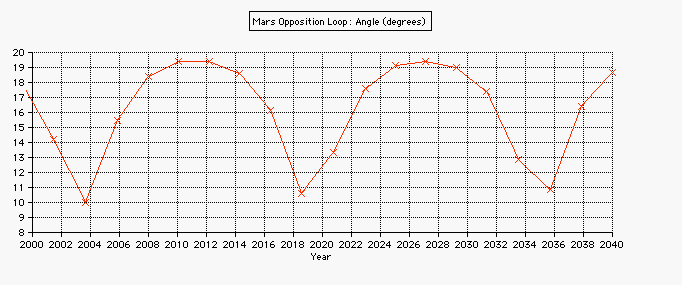
The shape
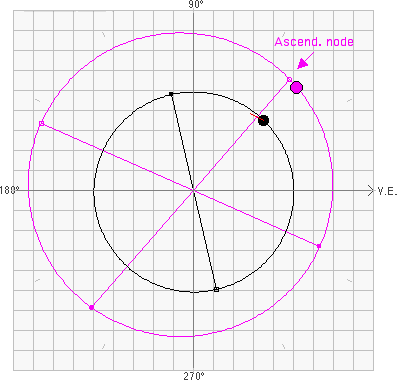
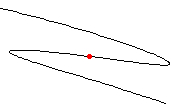
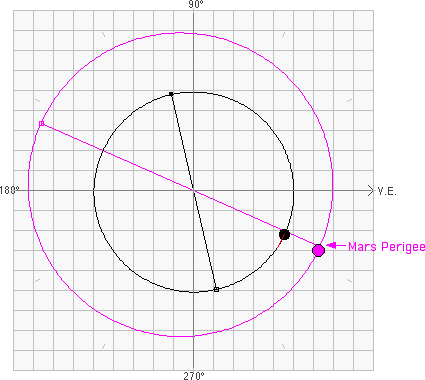
of the loops depends on the position of Mars with respect to the nodes
of Mars' orbit: |
|
The
opposition of 2005, Nov 07 occuring near the ascending node (shape of "Z") |
|
The
opposition of 2031, May 04 occuring near the descending node (shape of "S") |
|
The
opposition of 2010, Jan 29 occuring half way between the nodes |
|
The
opposition of 2018, Jul 27 occuring half way between the nodes |
|
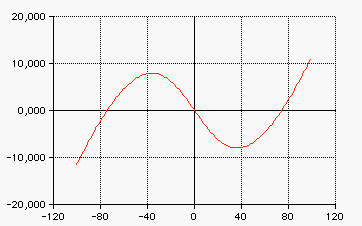
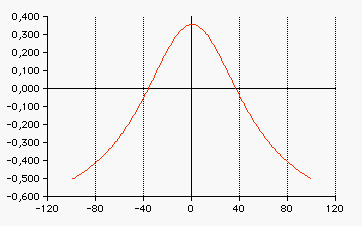
The first diagram is showing the angular distance (eta in degrees, vertical axis) of Mars from it's position at opposition as a function of time (days before and after opposition, horizontal axis). The second diagram is showing the angular velocity (∆eta/∆t in degrees per day, vertical axis) as a function of time (days before and after opposition, horizontal axis). The total duration of the oppostion loop is about 73 days, and the variation of eta is 0° +/- 8° |
|
Both
diagrams are computed from rP / rE =
sin(η+ε)/sin(η+β), resolved to: η = arctan((sin ε - K*sin β)/(K*cos β - cos ε)), and K=rP/rE |
The first diagram is showing the angular velocity (∆eta/∆t in degrees per day, vertical axis) as a function of time (days before and after opposition, horizontal axis). The total duration of the oppostion loop is about 73 days, and the variation of eta is 0° +/- 8° The first diagram is showing the angular distance (eta in degrees, vertical axis) of Mars from it's position at opposition as a function of time (days before and after opposition, horizontal axis). |
|
Both
diagrams are computed from rP / rE =
sin(η+ε)/sin(η+β), resolved to: η = arctan((sin ε - K*sin β)/(K*cos β - cos ε)), and K=rP/rE |