Projections of the Earth onto a Plane
|
The 'Map Projection Catalog' (see link below) is presenting a collection of
324 Map Projection Graphics !
A few of them are implemented in my Java applet. The algorithms to compute bearings, distance, midpoint, and destination are from Movable Type Ltd (see link below). Select a map projection frpm the menu: 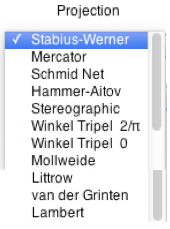
Compute distance and bearings
between to points given by latitude and longitude:
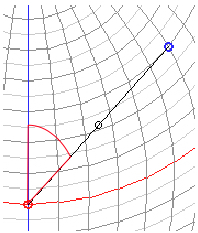
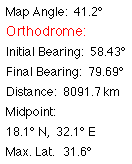
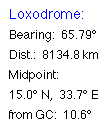
 Select Latitude 1, Longitude 1 of point 1 ( The distance (kilometers) is computed along a great-circle between the two points. The Midpoint is the center of the two points on the great-circle. Max. Lat. is the latitude of the closest point of the complete great circle to the north pole. The loxodromic path is drawn by 9 intermediate point. Compute destination point given
distance and bearing from start point:
 Bearings are in the range 0° to
360°, clockwise from North (90°=E, 180°=S, 270°=W).
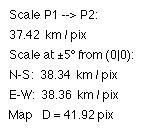
The Earth's radius is assumed to be 6371 km. The value of "Scale" is the ratio of the great circe distance of the two points (km) and the length of the black line connecting the points on the plane of projection (pixels). Compute loxodrome given
bearing from start point:
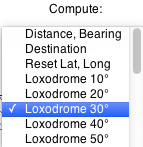 Select Latitude 1, Longitude 1, and the bearing of the loxodrome. The path is computed and marked every 100 km (larger mark every 500 km), for a total length of 40,000 km. For some maps a standard parallel can be chosen, where the projection shows no distortion:  Numerical output:
 1. Stabius-Werner The originators were Johannes Werner
(1466–1528), a parish priest in Nuremberg, refined and
promoted this projection that had been developed earlier
by Johannes Stabius (Stab) of Vienna around 1500.
Properties: Distances are correct from one pole, as well as along all parallels. Area preserving (Equal-Area). Parallels are concentric circles about the North Pole. No distortion along the central meridian. rho= 90° - latitude E = longitude*cos(latitude)/rho x = r*sin(E) y = 90 - r*rho*cos(E) 2. Mercator
The Mercator projection is a cylindrical map projection presented by the Flemish geographer and cartographer Gerardus Mercator (Geert de Kremer) in 1569. Properties: Lines of constant course, known as rhumb lines or loxodromes, are represented as straight segments that conserve the angles with the meridians. Conformal: preserving the angles and the shapes of small objects. Distorts the size of objects as the latitude increases from the Equator. K = π/180 x = K*longitude y = 0.5*r*log[(1+sin(K*latitude))/(1-sin(K*latitude))] 3. Schmid Net
The projection can only represent one hemisphere of the earth. Properties: Area preserving (Equal-Area) angle distorting: most of the grid lines do not intersect at right angles. px = cos(latitude)*sin(longitude/2) pz = cos(latitude)*cos(longitude/2) x = 2*r*px/sqrt(1+pz) py = sin(latitude) pz = cos(latitude)*cos(longitude/2) y = r*py/sqrt(1+pz) 4. Hammer-Aitow
This projection was described by Ernst von Hammer in 1892. It displays the world within a 2:1 elliptical outer shape, and is used even today for world maps. Properties: Equal-Area 2:1 elliptical outer shape The vertical coordinates (longitude) are divided by two, and the values of the meridians from the center are doubled: px = cos(latitude)*sin(longitude/2)
pz = cos(latitude)*cos(longitude/2)
x = 2*r*px/sqrt(1+pz) py = sin(latitude) pz = cos(latitude)*cos(longitude/2) y = r*py/sqrt(1+pz) Winkel's Tripel projection is one of three projections proposed by Oswald Winkel in 1921. The projection is It is the arithmetic mean of the equirectangular projection and the Aitoff projection: Winkel's Tripel alhorithm averages x and y-coordinates of the equidistant cylindrical projection, this time with the Aitoff projection's. Properties: Not equal-area, not conformal. Parallels are straight at Equator and poles, curved elsewhere; scales are constant, but not equal, only at the Equator and central meridian. K = π/180 alpha = arccos(cos(latitude)*cos(0.5*longitude)) si = sin(alpha)/(alpha/K) With the conventional standard parallel: phi1=±2/π With the equator as the standard parallel: phi1=0; x = R*0.5*[longitude*cos(phi1) + 2*cos(latitude)*sin(0.5*latitude)/si] y = R*0.5*[latitude + sin(latitude)]/si) 7. Mollweide
The projection was first published by mathematician and
astronomer Karl Brandan Mollweide (1774 – 1825) of
Leipzig in 1805.Properties: 2:1 elliptical outer shape Equal-Area accuracy of proportions in area Rx = 2*sqrt(2)/π Ry = sqrt(2) K = π/180 x =Rx*lambda*K*cos(t) y =Ry*sin(t) t is given by the equation: 2*t + sin(2*t) = π*sin(latitude), which has to be solved by an iteration: tn+1 = tn - [2*tn + sin(2*tn) - π*sin(latitude)] / [2 + 2*cos(2*tn*k))] 8. Littrow
This projection was developed by Joseph Johann von Littrow in 1833. It is the only conformal retroazimuthal map projection. As a retroazimuthal projection, the Littrow shows directions, or azimuths, correctly from any point to the center of the map. x = R*sin(longitude)/cos(latitude) y = R*cos(longitude)*tan(latitude) 9. Van der Grinten
The Van-der-Grinten projection was published in 1904 by Alphons J. van der Grinten (1852–1921). It projects the entire Earth into a circle Properties: not equal-area not conformal polar regions are subject to extreme distortion k = π/180 phi=K*phi; lambda=K*longitude; A = 0.5*abs(π/longitude - longitude/π) theta = arcsin(2*latitude/π); G = cos(theta)/(sin(theta)+cos(theta)-1) P = G*(2/sin(theta)-1) N = P*P+A*A Q = A*A+G x = R*π*(A*(G-P*P) + sqrt(A*A*(G-P*P)*(G-P*P)-N*(G*G-P*P)))/N y = R*π*(P*Q - A*sqrt((A*A+1.0)*N-Q*Q))/N 10. Lambert Equatorial
Azimuthal Equal-Area
root = R*sqrt[2/(1 +
cos(latitude)*cos(longitude))]
x = root*sin(longitude)*cos(latitude) y = root*sin(latitude) 11. Lambert Equatorial
Azimuthal Equidistant
alpha =
arccos[cos(latitude)*cos(longitude)]
x = alpha*R*cos(latitude)*sin(longitude)/sin(alpha) y = alpha*R*sin(latitude)/sin(alpha) 12. Braun
This stereographic cylindrical projection was designed by Carl Braun (1867). Properties: asymmetric scaling horizontally and vertically K = π/180 x = R*K*longitude y = 2*R*tan(latitude/2) 13. Sinusoidal
The sinusoidal projection is a
pseudocylindrical equal-area map projection,
sometimes called the Sanson–Flamsteed or the
Mercator equal-area projection.
Properties: equal-area x = R*longitude*cos(latitude) y = R*latitude 14. Eckert III
Max Eckert-Greifendorff presented six map projections in 1906. The latitudes are parallel lines in all six projections. In Eckert III meridians are elliptical, the outermost are semicircles, and the length of the central meridian is half the length of the equator. Properties: not equal-area not conformal x = 0.5*R*longitude*[1 + sqrt(1-latitude2/902)] y = R*latitude 15. Gnomonic
A points on the surface of the Earth's sphere is projected from the sphere's center to a point in a plane that is tangent. Antipodal points appear at the same point in the plane. Thefore it can only be used to project one hemisphere. x = R*tan(longitude) y = R*tan(latitude)/cos(longitude) 16. Polyconic
K = π/180 E = longitude*sin(latitude) x = R*sin(E)/tan(latitude) y = R*[K*latitude + (1 - cos(E))/tan(latitude)] 17. Albers
This projection was published in 1805 by Heinrich C. Albers (1773–1833). The cone is intersecting the globe in two standard parallels (or is tangent in one standard parallel). Properties: equal-area scale and shape are not preserved distortion is minimal between the standard parallels. Standard Parallels: 0°, 60° n = 0.5*sin(60) theta = n*longitude rho = sqrt(1-2*n*sin(latitude))/n rho0 = 1.0/n x = R*rho*Math.sin(K*theta) y = R*[rho0 - rho*cos(theta)] 18. Bonne
The projection is named after Rigobert Bonne (1727–1795), although it was in use prior to his birth. Properties: Parallels of latitude are concentric circular arcs, and the scale is true along these arcs. On the central meridian and the standard latitude shapes are not distorted. Meridians: Central meridian is a straight line. Other meridians are complex curves connecting points equally spaced along each parallel of latitude and concave toward the central meridian. rho = 1/tan(paral) + K*paral - K*latitude E = K*longitude*cos(latitude)/rho x = R*rho*sin(E) y = R*[1/tan(paral) - rho*Math.cos(E)] 18. Lambert Conic
This projection is one of seven projections introduced by Johann Heinrich Lambert in his 1772 publication. Properties: Conformal Straight line drawn on a Lambert conformal conic projection approximates a great-circle route between endpoints for typical flight distances. Two parallels can be assigned unit scale, with scale decreasing between the two parallels and increasing outside them. This gives the map two standard parallels. K = π/180 n = sin(paral) F = cos(paral)*tann(π/4+0.5*K*paral)
rho0 = F/tann(π/4)rho = F/tan(π/4+0.5*K*latitude) x = R*rho*sin(n*longitude); y = R*[rho0-rho*cos(n*longitude)] 19. Craster
This projection was developed by John Evelyn Edmund Craster in 1929; it was further developed by Charles H. Deetz and O.S. Adams in 1934. It was presented independently in 1934 by Putnins as his P4 projection. Properties: equal-area meridians are equally spaced parabolas parallels are unequally spaced straight parallel lines free of distortion only at the two points where the central meridian intersects the 36º46' parallels K = π/180 x = R*sqrt(3/π)*K*longitude*[2*cos(2*latitude/3)-1] y = R*sqrt(3*π)*sin(latitude/3) |
2016-2023 J. Giesen
updated: 2023, Oct 06
